Temporal patterns in the network
In this section we wanted to analyse the temporal patterns of connections between The Office characters. Given the lack of temporal information on the wiki-pages, we went ahead and created new weighted networks based on the scenes of each season. That is, the more scenes two characters share throughout a season, the more strongly connected they are in the seasons network. The network for a given season can be found below. Feel free to play around with it and have a look at each individual season!
Average Clustering coefficients for the networks
The graph below shows the evolution of the average clustering coefficient for the season networks across seasons. It is apparent that the network is more clustered through the mid-to-late seasons than the first seasons. This shows that the initial four seasons, where the highest clustering coefficient is 0.77, told stories involving main characters with side characters. However, in the mid-to-late seasons five, six and seven an increased interactions between these side characters of the show can be noticed, here the lowest clustering coefficient found is 0.79. In the later seasons the side characters are no longer simply present to facilitate interactions between main characters, rather they have story involving each other. On the surface this seems like a natural progression of a television show, early on the story revolves mainly around a few characters and as the audience gets more familiar with those, the show may more easily introduce backstory or side stories for previously bland side characters.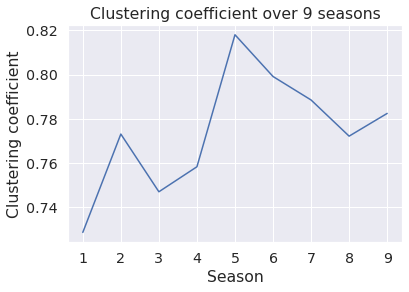
Network degree exponent for the networks
When analysing each seasons network degree exponent, found in the graph below, it is clear that season one is an outlier. To that point, it is important to note that season one is an outlier in itself, as it has just six episodes, whereas the remaining seasons have somewhere in the neighborhood of 20 episodes. The difference in exponent between season two and the remaining seasons however, is a more interesting topic of discussion. The exponent of the network for season two is 2.97 and the highest exponent for the rest of the shows lifespan being 2.07 remarkably lower. This shows that, the network covering dialogue in season two is just on the cusp of a random network, and that the network for the following seasons is more clearly within the scale-free regime[1]. This shows an interesting phenomenon in the show; that especially in the outlier season one, but also in season two the characters, who interact with each other, is significantly more random than the remaining seasons. One explanation for this could be that, during the initial seasons of the show, the writers did not know exactly where they wanted to take each different character and their interactions, and that this resulted in the higher randomness than the following seasons. This could tie in with the fact that the writers also did not know which characters the audience liked the most, and by extension which characters the writers should spend more time on developing.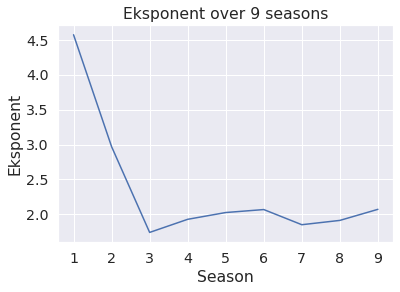
Interactions of Dwight
The following section dives into the interactions between the character Dwight and a few of the other main characters. It is important to note that the graph displays the average interactions during an episode for a given season. This ensures that even though season one has fewer episodes, it will still be comparable. With that said it is interesting to see that Michael is by far the characters Dwight interacts with the most throughout the first six seasons. During season seven, leading up to Michaels departure from the show in season eight and nine, Jim became the character Dwight interacted with the most and from season eight rivaling Michaels previous average interactions. Another interesting point to draw from the graph is Dwights increased interactions between season four and five. With the exception of Ryan, Dwights interaction count was even or up across the board between the two seasons even when accounting for the increased number of episodes in season five compared to four. This could indicate the writers wanting to increase his role in the show or shift his role into interacting with a higher varity of other main characters.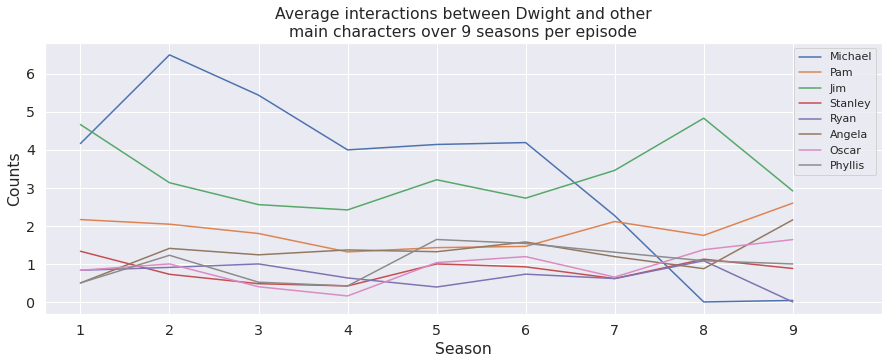
References
[1] Barabási, Albert-László (2016) “Network Science” Chapter 4; section 7. http://networksciencebook.com/chapter/4#degree-exponent.